
Real horsepower.
No dyno needed.Prove your tune
worked.Dyno proof for
every customer.
Your car’s true crank horsepower and torque, measured on a quiet road in minutes. One full-throttle pull, one coast-down — a 25 Hz GPS sensor and your phone. Every result carries its confidence band, so the number you get is one you can trust.
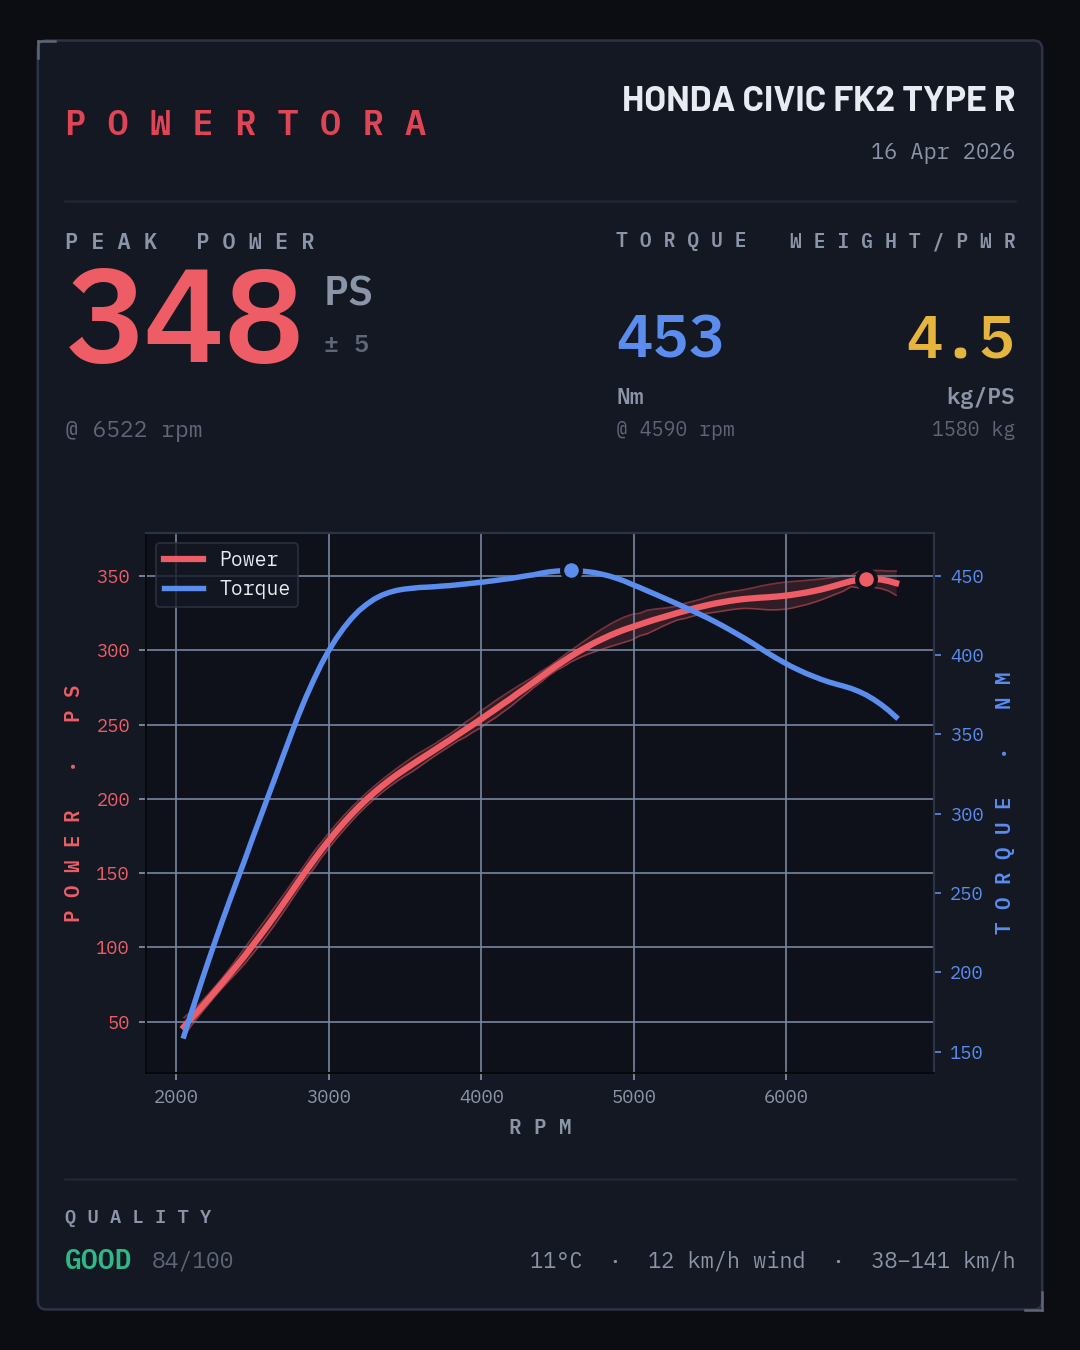
Measure before. Flash the map. Measure after — same road, same hour. Powertora reads the gain with the error bar that makes it believable (348 ± 5 PS), not another dyno-day story.
Printable A4 dyno reports, dark share cards and QR-verified live web results — hand every customer proof their money bought power. Measured on the road, DIN 70020-corrected, with the uncertainty shown.
RaceBox & Dragy supported · metric PS · crank-equivalent
- 25 Hz GPS sampling
- ±1.3 PS vs truth models
- 1.3 % session repeatability
- DIN 70020 corrected
What does your car
really make?You changed a part.
You want the number now.Your customers want proof,
not promises.
The spec sheet says one thing, the seller said another, and the butt-dyno always lies. Powertora measures what your engine actually makes today — on any quiet stretch of road, in one 20-minute session — not what the brochure promised ten years and two owners ago.
Most apps estimate power from acceleration alone. Powertora measures the losses too. Tuning is a loop — change something, measure, compare, repeat — and a real dyno breaks that loop with cost and logistics, then hands you a number you can’t reproduce. Powertora gives you a repeatable, physics-honest measurement on any quiet stretch of road, so a week-to-week +8 PS claim is one you can actually trust.
A measured curve sells the next stage better than any forum post. Powertora turns every build into a documented before/after — measured on the road by your shop, DIN-corrected, reproducible — without queueing for the district’s one rolling road.
No dyno within reach
Rolling roads are rare, booked out, and cost real money for a single number. Your road is right there.
Numbers you can’t compare
Wheel HP, “corrected” HP, brochure HP — all different. Powertora reads crank-equivalent PS, measured the same way every time.
Settle the claim
Buying or selling — measure it. One session answers a “310 PS, stage 1” ad before money changes hands.
No appointment, no flatbed
A rolling-road session means booking time, trailering the car, and a half-day gone. You just want the number.
Rear-wheel guesswork
Most cheap measurements report wheel power, then bolt on a made-up drivetrain factor. The result is unverifiable.
No week-to-week truth
Different dyno, different day, different correction — the numbers never line up, so you can’t trust a +8 PS claim.
The dyno queue kills margin
Trailer, appointment, half a day per car. Measure on the road next to your shop in twenty minutes instead.
Claims need receipts
A stage-2 invoice with no evidence invites disputes. Ship every map with a measured curve and a QR-verified report.
Comparable across cars
Same protocol, same correction, every customer car — results your customers can check themselves, any time.
Acceleration is power.
Coast-down is the loss.
One pull shows acceleration; the coast-down proves the losses. How hard the car accelerates tells you how much power the engine makes; how it slows when you lift measures how much drivetrain and air drag steal back — same road, same car, same session, not a generic drivetrain percentage. Subtract one from the other and you get crank-equivalent power — the crank-vs-wheel question settled by measurement, not a fudge factor.
- 01
Connect a 25 Hz GPS sensor
Pair a RaceBox Mini or Dragy over Bluetooth — or several at once. Powertora records position and speed at 25 Hz, the resolution real timing demands.
- 02
One pull, then coast
Full throttle in 3rd gear from ~2000 rpm to the limiter, then clutch in and coast back down the same road. The pull reads engine power; the coast measures drivetrain and aero losses live. Auto mode starts and stops each phase for you — or drive it fully manual if you want to call every step.
- 03
Read your curve — with its error bar
Get an RPM-indexed power and torque curve with a confidence band (“348 ± 5 PS”), peak PS @ rpm, peak Nm, a loss breakdown, and a 0–100 quality score — corrected to standard atmosphere. Overlay another run to read the before/after gain.
A peak number is easy.
A repeatable curve is hard.
Built for before/after tuning truth. Behind the app runs a complete car physics model — every force that moves the car, every part that spins with it, the air it pushes through and the road beneath it. The precision that usually lives on a rolling road, in an instrument you can run anywhere.
Before / after, proven
Overlay stock vs remap, 95 vs 98 RON, cold vs hot — same road, same day — and read the gain as “+8 PS · +3.4%”. Designed to prove a modification actually worked.
A number with an error bar
Every result reads “347 ± 4 PS”, with a shaded confidence band on the curve. The ± is the real run-to-run scatter of your session — honest, measured precision, not a fabricated fourth digit.
Repeatability, front and centre
A clean 3-run session reports its own peak spread and curve spread — ≈3 PS / 1.3% on a good road. A single peak number is entertainment; a repeatable curve is measurement.
The complete tuning workflow.
Measurement, PNG share cards and live web reports stay free. Pro adds the tools for repeatable sessions, deeper analysis and recovery.
PDF dyno reports
Printable A4 reports with the curve, peaks and quality breakdown.
Run merging
Average 3–6 runs into one high-confidence curve.
Comparison exports
Before/after PDF reports and share cards for every change.
Multi-GPS fusion
Fuse several 25 Hz sensors to reduce measurement noise.
Unlimited garage
Keep every car you measure, tune and compare.
Road maps
Inspect curvature, grade and wind alongside each run.
Cloud backup & recovery
Restore your cars and saved runs after reinstalling the app.
Cloud backup contains only cars and saved runs — never raw recordings, purchase tokens, device settings or Bluetooth configuration.
Crank power, not guesswork
The coast-down captures real drivetrain loss every run, so the output is crank-equivalent by measured loss — not a “×1.15 to the flywheel” multiplier.
Nothing to calibrate
No Cd, frontal area or drivetrain factor to look up — the coast-down measures your car’s real losses on every run. The only number you enter is its weight.
See where the power goes
Each report breaks the peak down into aero, rolling + driveline, grade and the power left to accelerate — the one thing a single pull can never show.
Hands-free auto mode
Auto mode arms at your launch speed, stops itself when you lift off the limiter, and runs the coast on a timer — eyes on the road, not the screen. Manual start/stop stays there for drivers who want to call every step.
Multi-GPS fusion
Run two, three, even four sensors in a single pull. Powertora fuses the channels server-side for roughly √N noise reduction.
Merge to lab grade
Average 3–6 runs with automatic outlier rejection. Fine engine structure emerges, and a clean session holds within a few PS.
Transparent quality score
A 0–100 score weighs GPS fix quality, coast-fit coverage, RPM span, wind and grade — because bad data should look bad.
Engine-smart smoothing
An L1 trend filter erases GPS wrinkles while preserving real features — cam steps, VTEC kicks, boost ramps. Validated to halve curve noise (1.2 → 0.6 PS RMSE).
DIN 70020 correction
Every result is corrected to standard atmosphere (1013.25 hPa, 20 °C) from live air density — and the correction factor is shown, never hidden.
A live, shareable web report
Every result gets its own page at powertora.app — an interactive curve you can scrub, plus the road and grade it was driven on.
Verified, not just shared
Each result is sealed with an integrity hash of its raw trace and locked inputs; the share card and PDF carry a QR to the live report. Scannable proof, not just a picture.
Three formats, one run
A dark share card for messengers, a printable A4 PDF for the build thread, or the live web link. One pull, every way you need to share it.
This is what you get back.
Every pull produces a clean, shareable card: a full horsepower and torque curve, peak figures with the rpm they occur at, weight-to-power, and an honest quality grade with the conditions it was measured in. Scan the QR in the corner and it opens the same result as a live, interactive web report — or export it as a printable A4 PDF for the build thread. Overlay two runs of the same car and the gain reads directly — same road, same correction, no dyno-day excuses.
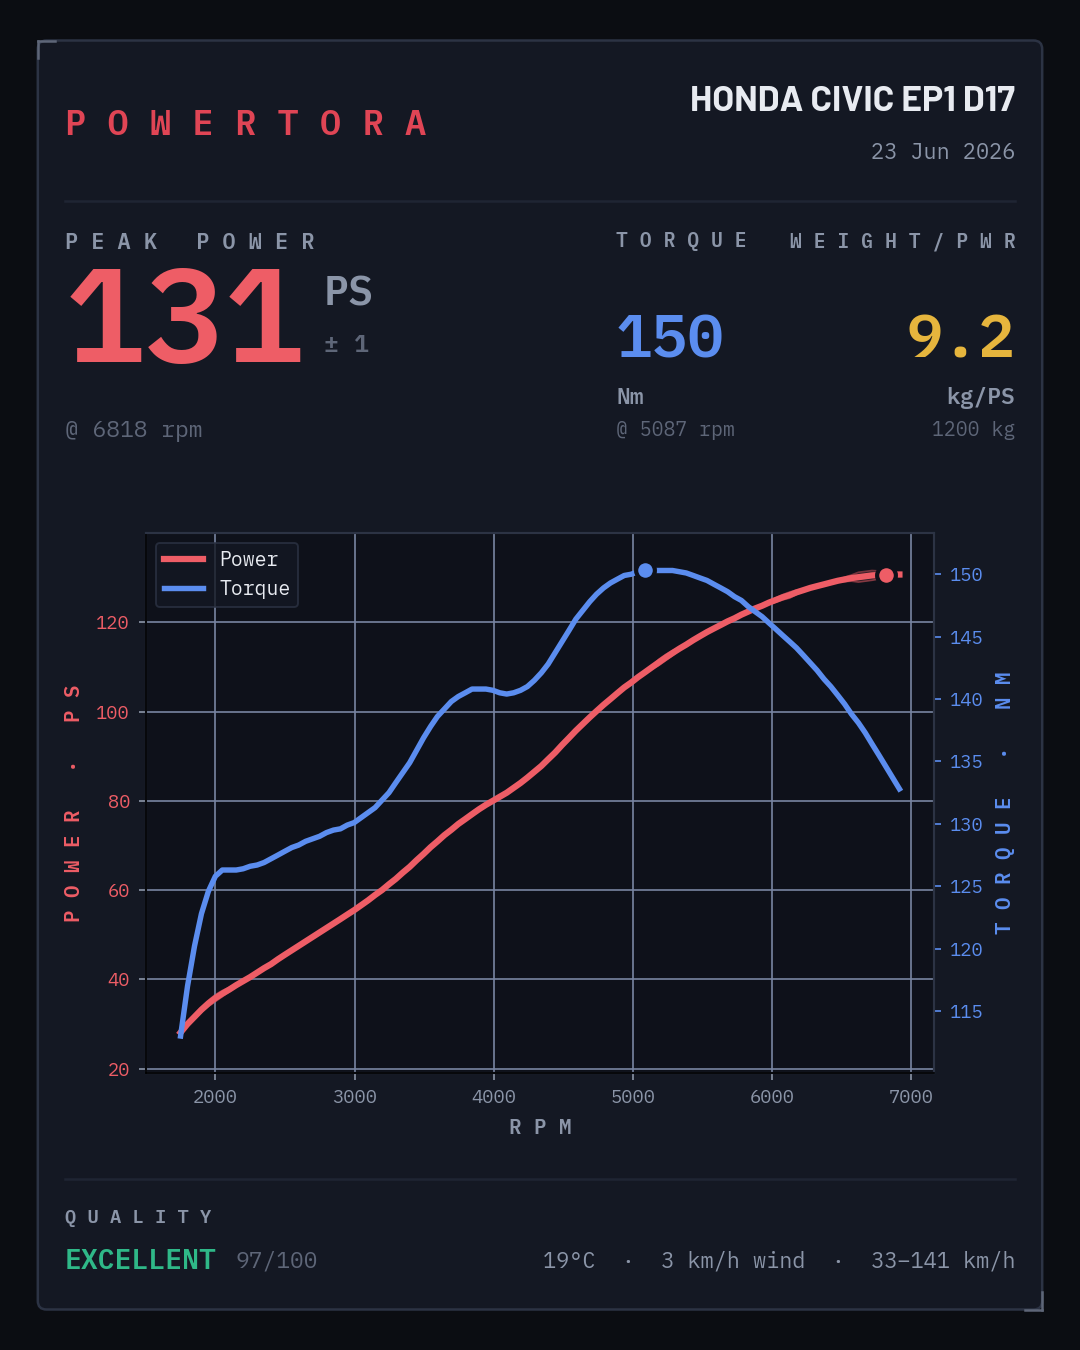
D17 swap · measured result · 1200 kg.
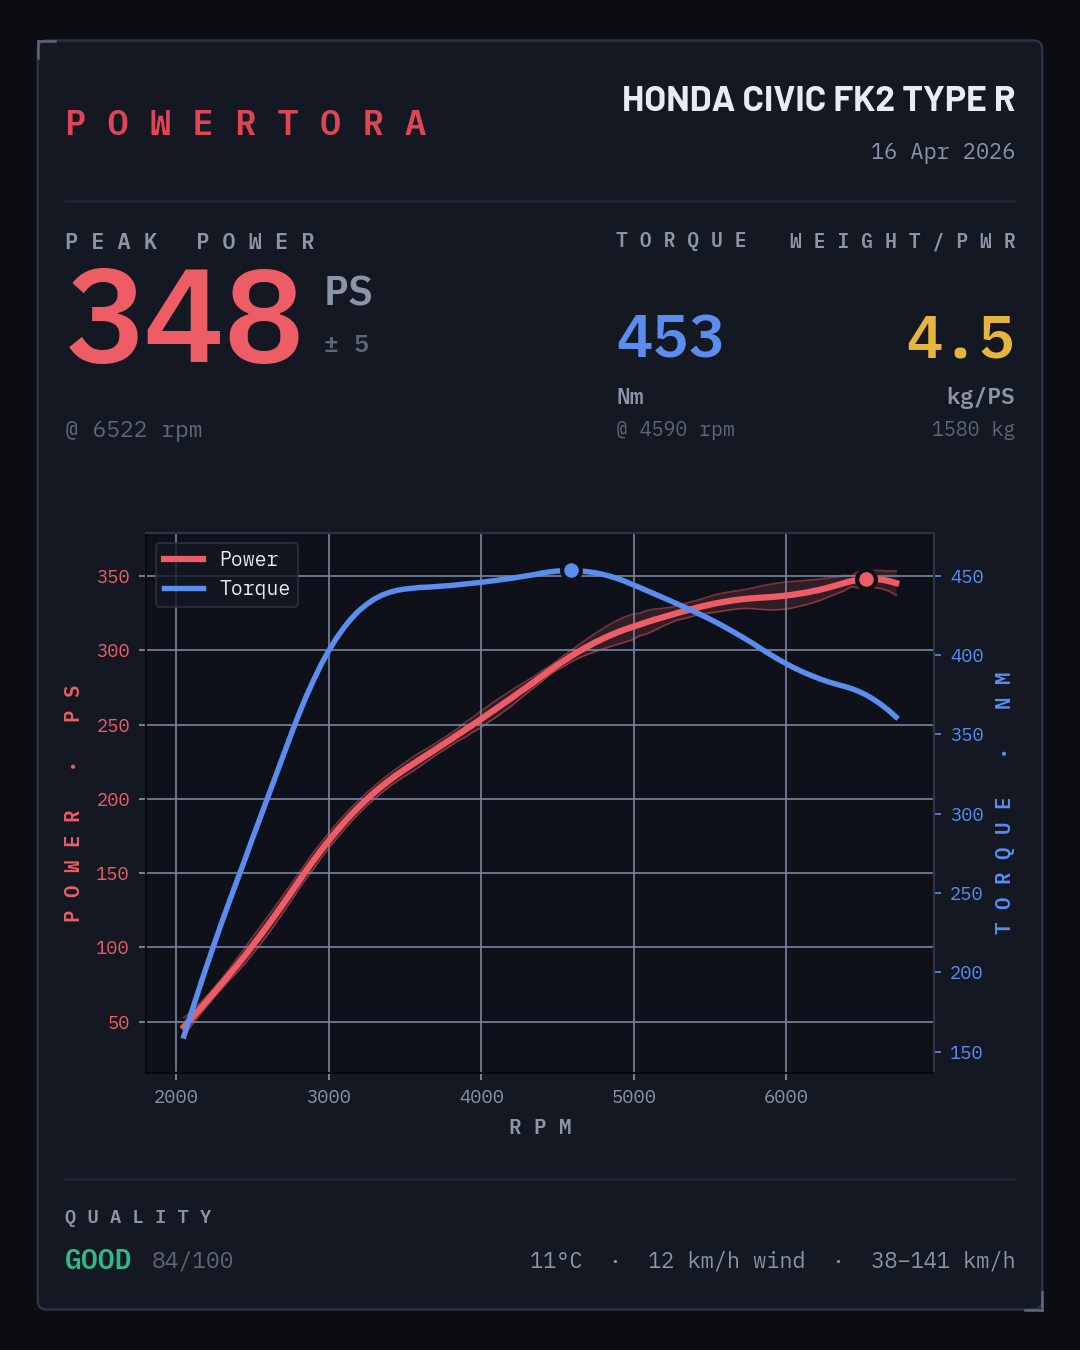
Turbocharged · measured result · merged from 6 runs · 1580 kg.
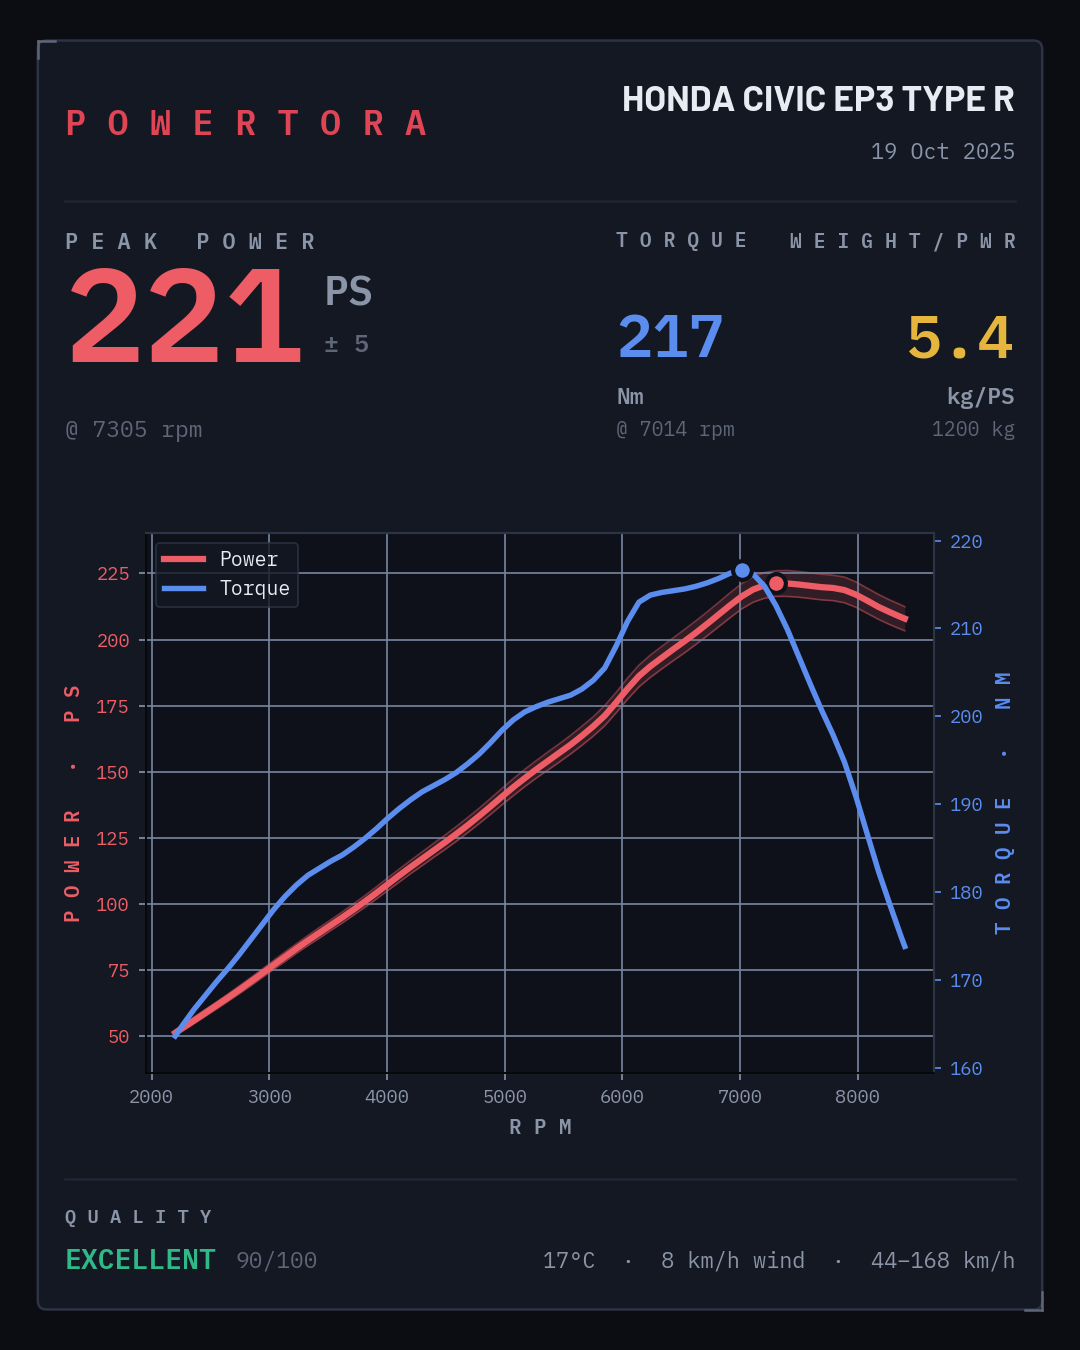
Naturally aspirated · 1298 kg.
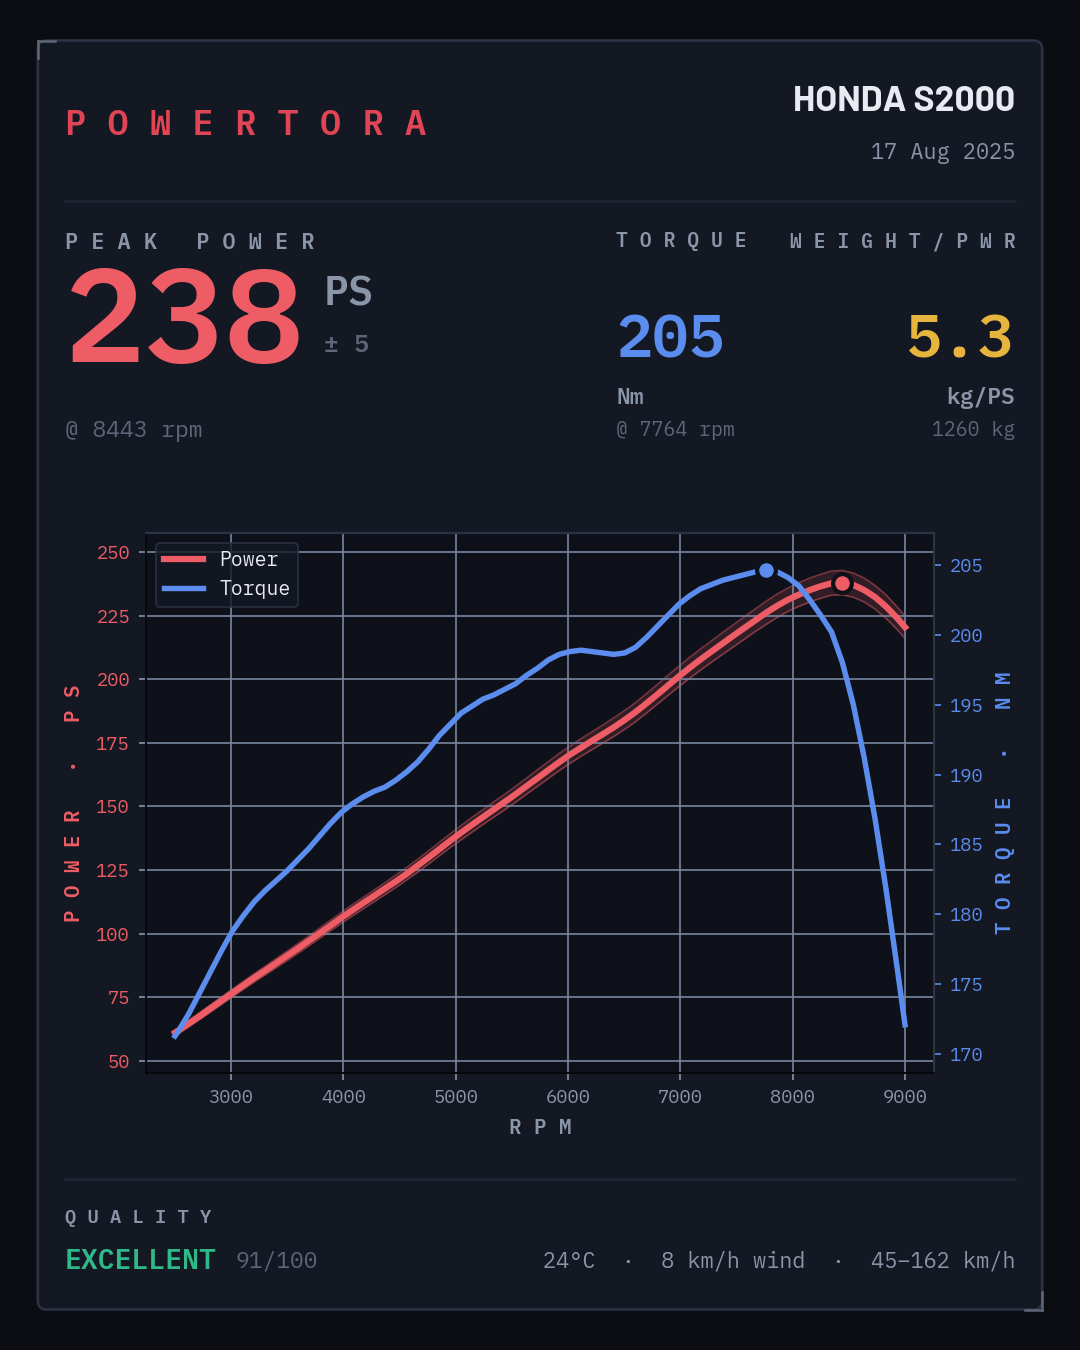
Stock · naturally aspirated · 1347 kg.
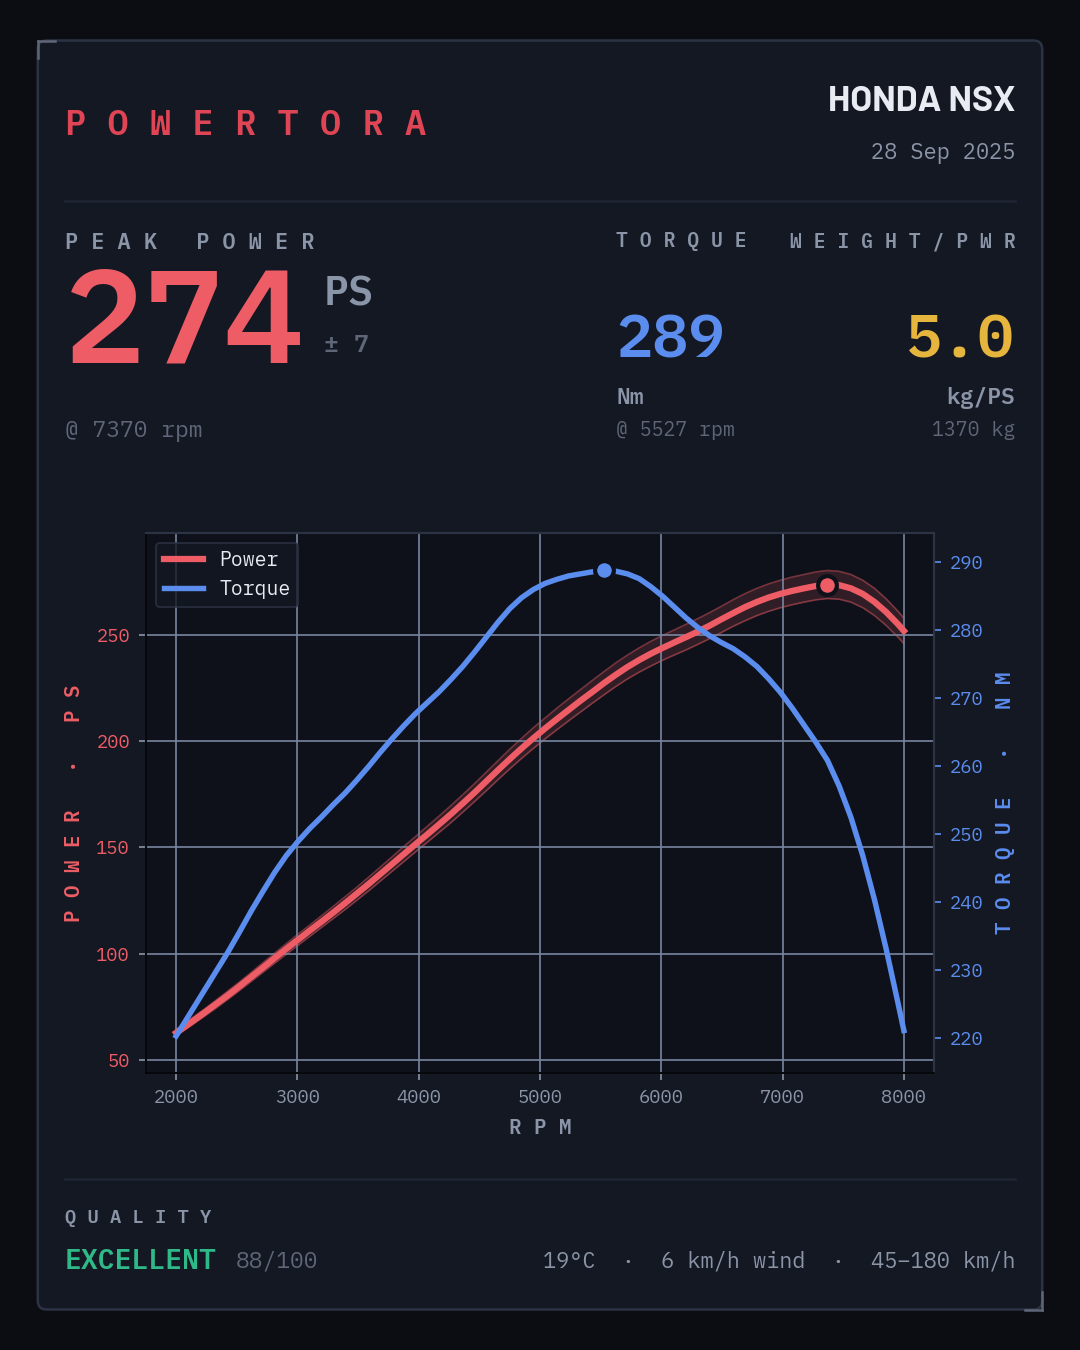
Stock first generation · naturally aspirated · 1462 kg.
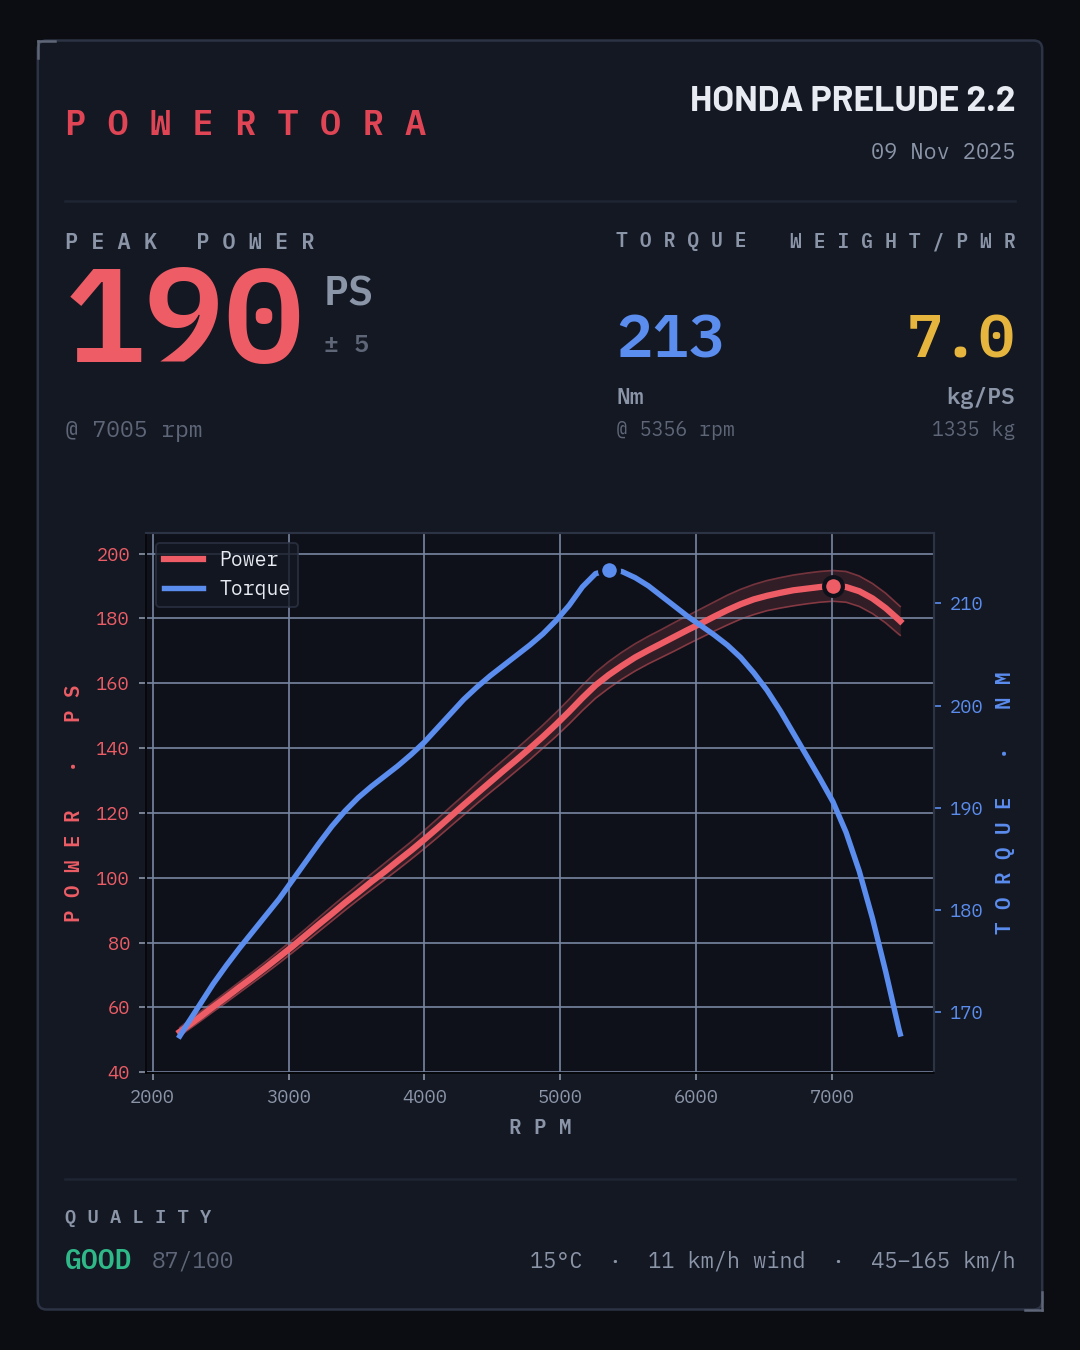
Stock · naturally aspirated · 1381 kg.
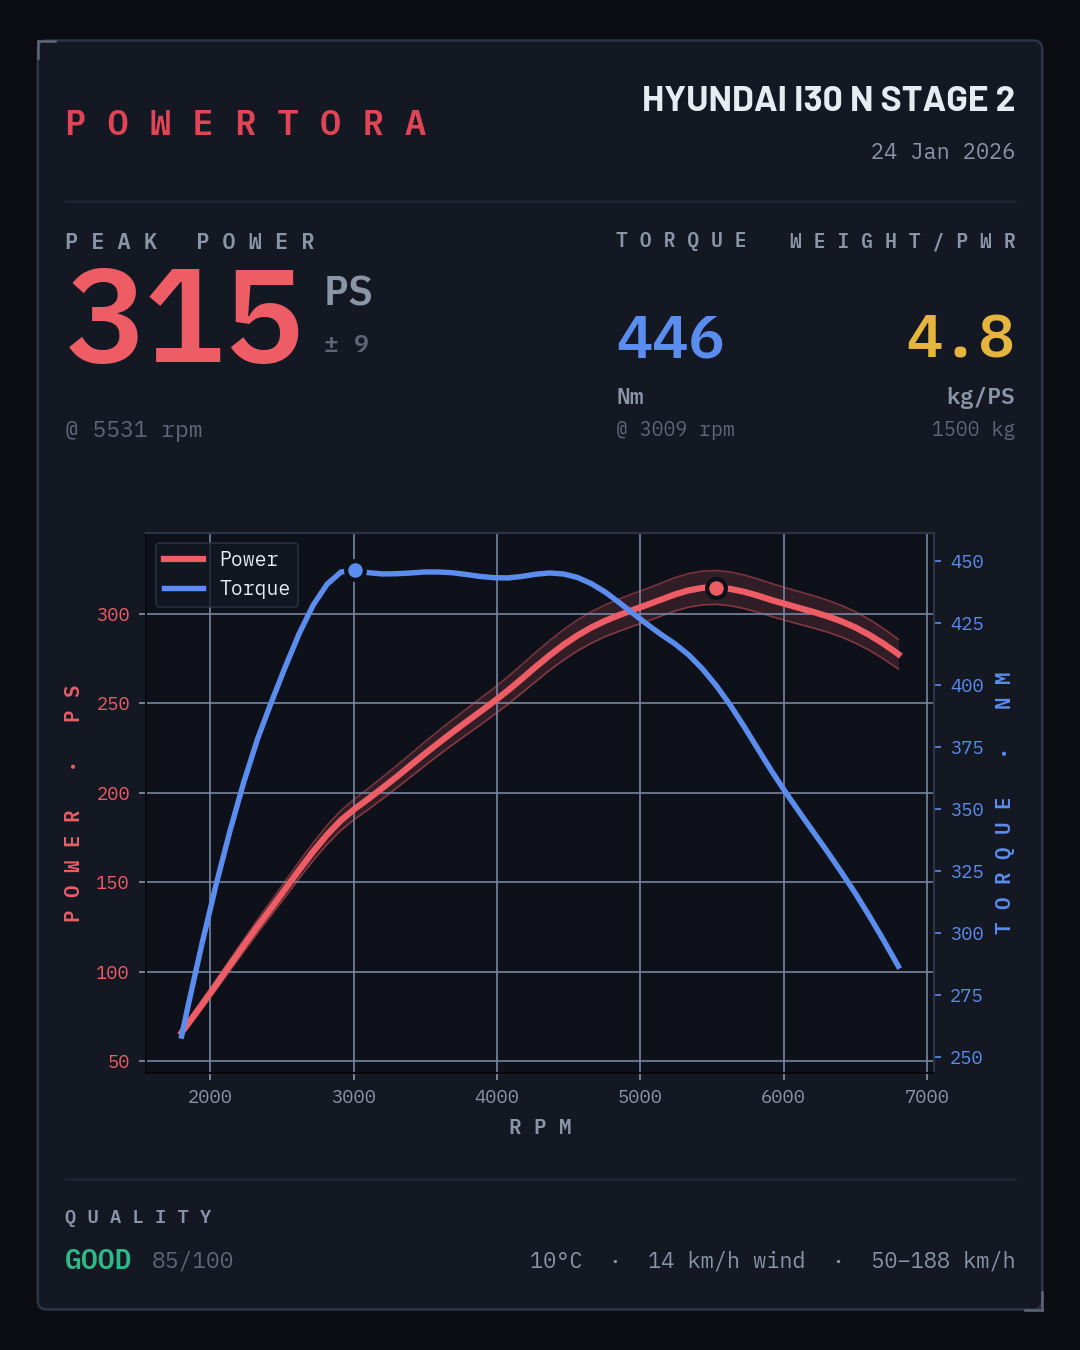
Stage 2 · turbocharged · 1529 kg.
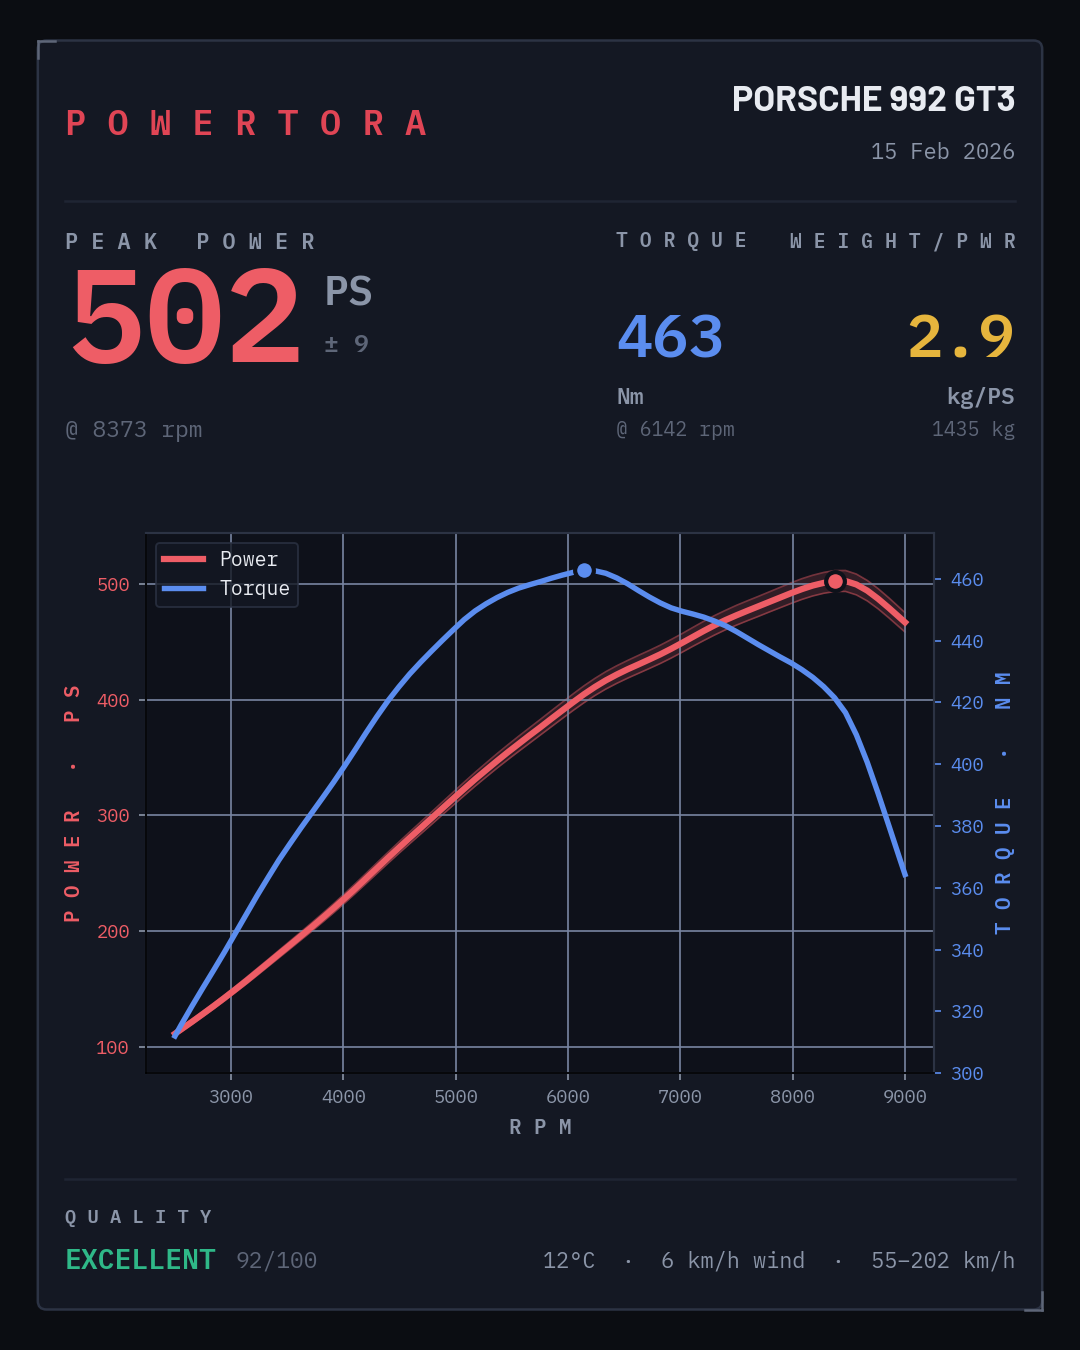
Stock · naturally aspirated · 1532 kg.
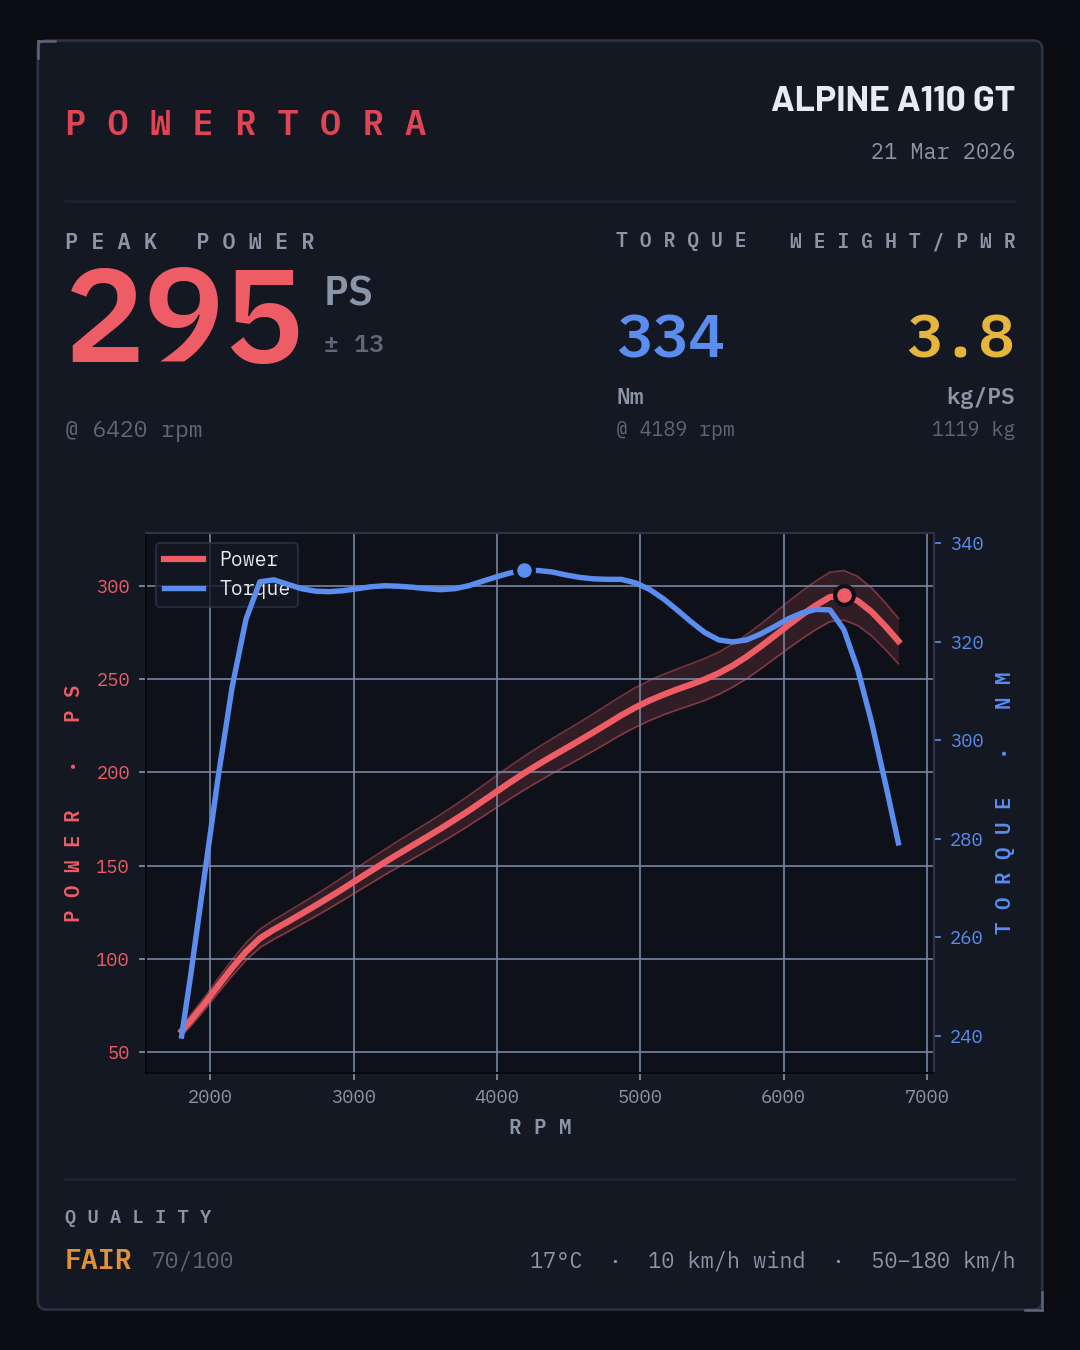
Stock · 1213 kg · estimated drag, no coast run.
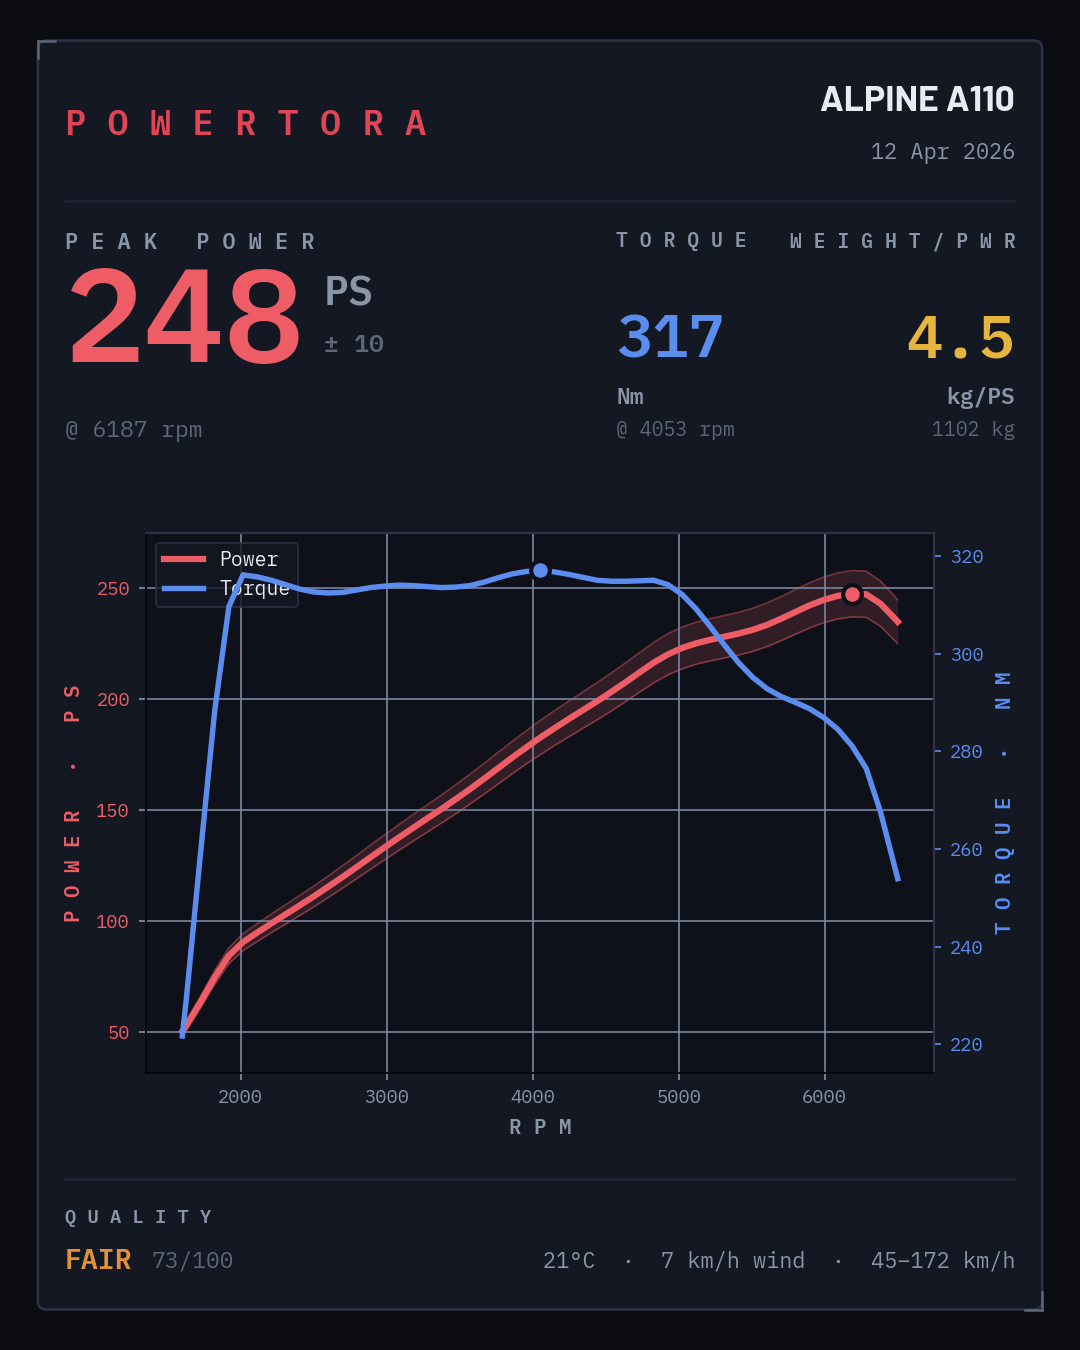
Stock · 1196 kg · estimated drag, no coast run.
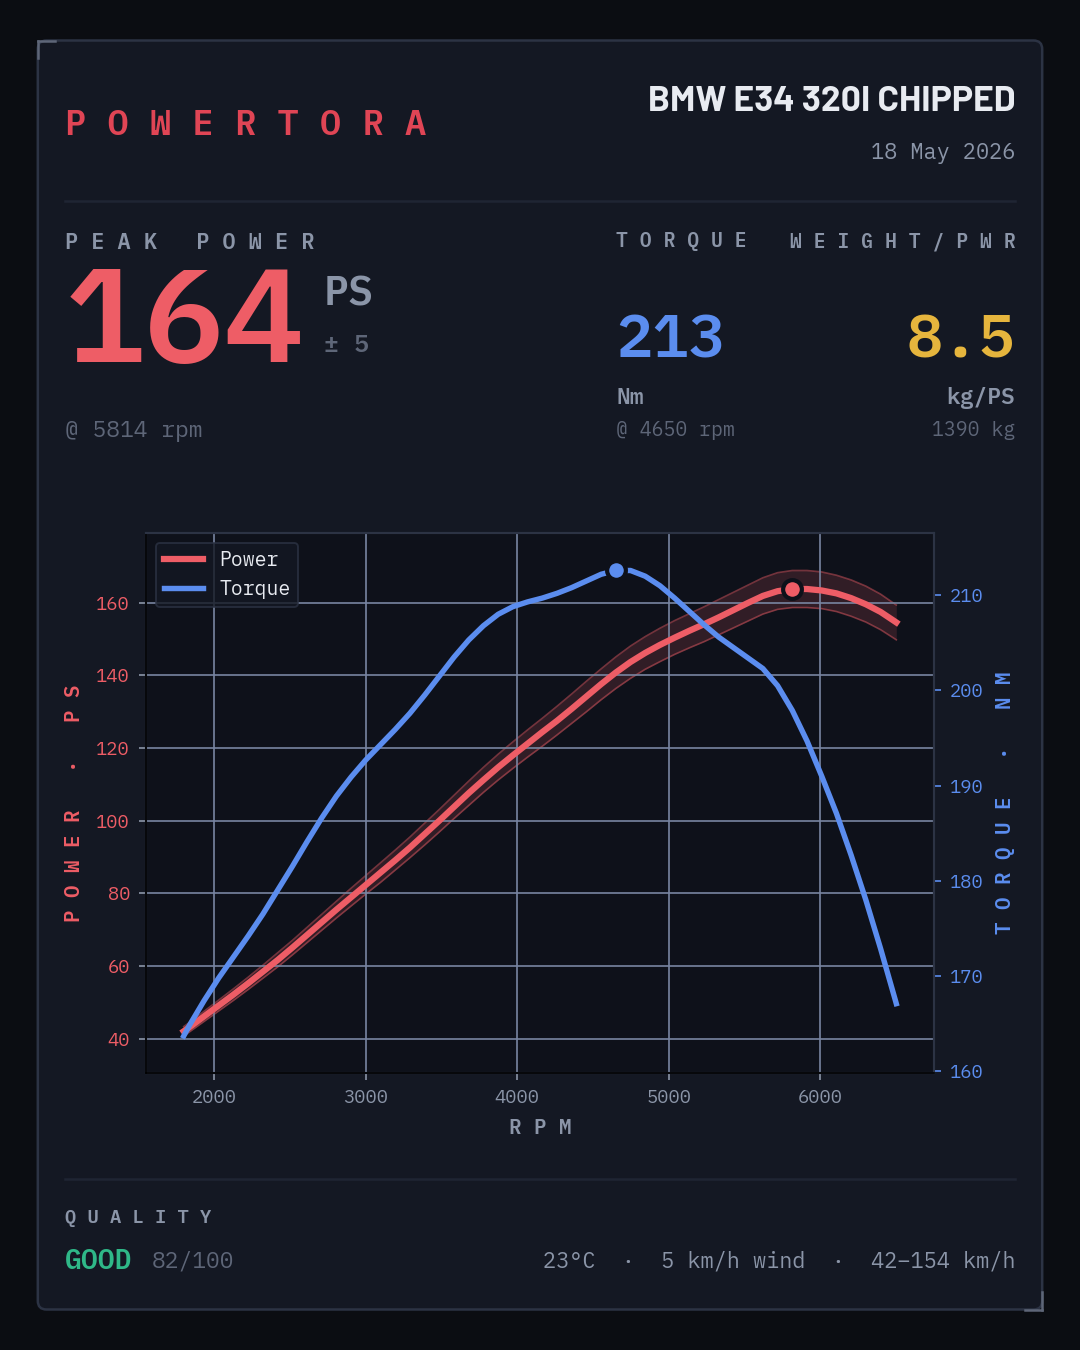
Chipped · naturally aspirated · 1487 kg.
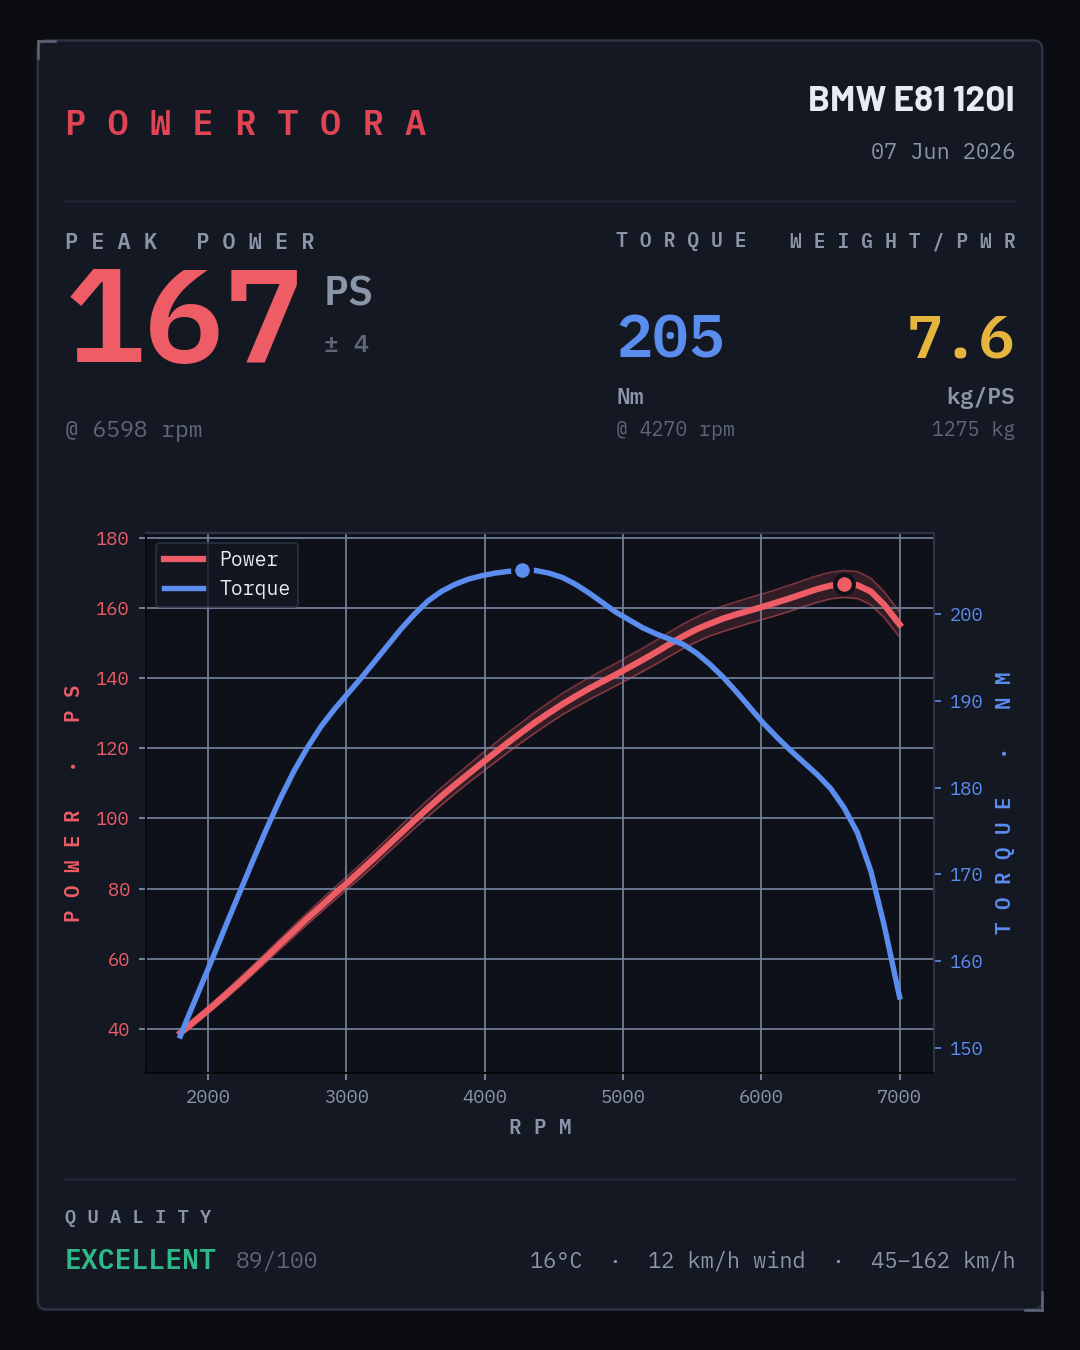
Stock · naturally aspirated · 1371 kg.
Validated on every change.
Accuracy isn’t a marketing word here — it’s a committed benchmark. Every algorithm change is scored against synthetic truth-model engines (smooth and cam-step) and against real recorded sessions before it ships, with an append-only history tracking the precision over time.
Peak error vs synthetic truth models, after engine-shape filtering.
GPS sample rate — sub-100 ms speed resolution on every pull.
Peak spread across a clean 3-run session (≈1.3% consistency).
Noise reduction from fusing N sensors in a single run.
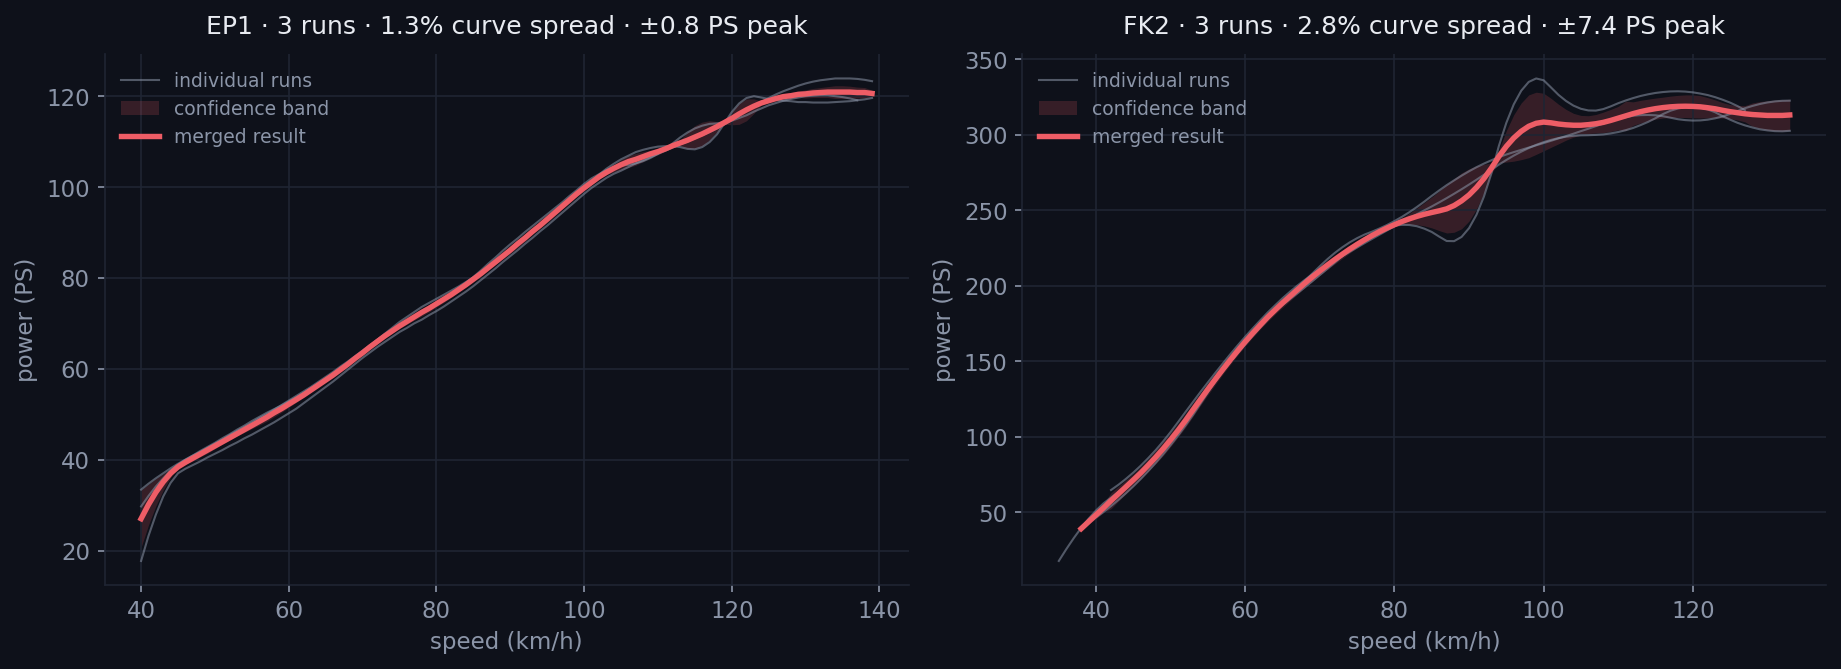
EP1 holds to 1.3%, the turbo FK2 to 2.8% — the band widens where runs disagree.
See the full validation — synthetic recovery, raw traces, outlier rejection & history →A rolling road isn’t a single absolute number either. Back-to-back runs on the same dyno typically scatter ~1–3%, and the same car reads 5–15% apart across different dynos and correction standards (SAE, DIN, EEC) — the reason “dyno shopping” exists. Powertora doesn’t pretend that uncertainty away: it measures its own spread and shows it as a ± band, so the comparison that actually holds — a before/after on your own setup — is the one it’s built for.
Benchmarked against real fixtures — a naturally-aspirated Honda EP1 and a turbocharged Honda FK2 — plus controlled synthetic engines with a GPS noise model calibrated from real RaceBox and Dragy hardware (≈0.019 m/s σ).
Bring a 25 Hz GPS sensor.
Powertora is built around dedicated 25 Hz GPS performance meters — the sample rate is what makes a clean power and torque curve possible. Pair one over Bluetooth and you’re ready to run; pair several and they fuse into one lower-noise result.
Every one is a 25 Hz GPS meter over Bluetooth LE.
- RaceBox Mini
- RaceBox Mini S
- RaceBox Micro
- Dragy 70
- Dragy Pro
- Dragy Lite
- Sample rate25 Hz GPS (sub-100 ms speed resolution)
- Multi-sensorFuse 2–4 units in one pull (√N noise cut)
- PhoneAndroid 12+ or iPhone (iOS 15.1+)
- LinkBluetooth LE required
Save 15% on your GPS hardware.
Use the matching code at checkout when you buy a supported sensor.
GPS dyno questions, answered.
What a GPS dyno can and can’t do — measuring horsepower and torque, supported RaceBox and Dragy sensors, crank vs wheel power, and checking your tune.
How accurate is a GPS dyno compared to a rolling road?
A GPS dyno is a repeatable, comparative measurement rather than a certified lab number. Powertora's pipeline is validated on every change: peak power lands within about ±1.3 PS of synthetic truth-model engines, and a clean three-run session repeats to roughly 1.3% (about 3 PS). That repeatability is what lets you trust a small before-and-after gain — something a one-off rolling-road session, on a different day with a different correction, can't promise.
Do I need a RaceBox or Dragy?
Powertora is built around 25 Hz GPS performance meters — pair a RaceBox Mini or a Dragy over Bluetooth and you are ready to run. You can even fuse several sensors in one pull to cut noise by √N. The high sample rate is what makes a clean power and torque curve possible, so a dedicated 25 Hz GPS sensor is what delivers dyno-grade results.
Can I measure horsepower without a dyno?
Yes. Instead of a rolling road, Powertora reads one full-throttle pull and a coast-down on a quiet road. The pull tells it how hard the engine accelerates the car; the coast measures how much drivetrain and aerodynamic drag steal back — from the same road, same car, same session, instead of a generic drivetrain percentage. Subtract one from the other and you get a real horsepower and torque curve — no dyno, no appointment, no towing.
Does it show wheel or crank horsepower?
Crank-equivalent. Because the coast-down measures your actual drivetrain and aero losses, Powertora reports power at the crank without bolting a made-up drivetrain factor onto a rear-wheel number. Everything is in metric PS and DIN 70020-corrected to standard atmosphere, so runs taken on different days line up directly.
Do I need to enter my car’s aero or drivetrain specs?
No. Unlike single-pull estimators that need a vehicle profile — drag coefficient, frontal area, drivetrain type — Powertora measures those losses directly from the coast-down on every run, so there is nothing to calibrate or guess. The only figure you provide is the car’s as-tested weight.
Will it show my tune or mod gains?
That is the point. The measurement repeats to about 1.3% on a clean session, so a genuine gain from a remap, intake, exhaust or other bolt-on stands out clearly against the run noise. Measure before, change the part, measure after on the same road — then compare the full curves, not just the peak number.
Which phones and sensors are supported?
Sensors: RaceBox Mini, Mini S and Micro, plus Dragy — any 25 Hz GPS performance meter over Bluetooth — and you can fuse two to four at once in a single pull. Phone: Android 12 or newer on Google Play, or iPhone on iOS 15.1 or newer from the App Store — Bluetooth LE required either way. Power is reported in metric PS, crank-equivalent and DIN-corrected — the honest number, not an inflated one.
Real horsepower,
measured on your road.Baseline today.
Prove the gain tomorrow.A measured curve
with every build.
Free to download. Pair a 25 Hz GPS sensor, find a quiet road, and get a real, repeatable power curve on your next pull.
Free to download. Measure before the map goes in, measure after on the same road — and read the difference with its error bar.
Free to start. Measure customer cars on the road by your shop and hand over printable, QR-verified proof with every invoice.
Android & iOS · RaceBox & Dragy · metric PS · crank-equivalent