
How we know the number is real.
A GPS dyno is only worth trusting if its accuracy can be checked. Every figure below is generated from the same benchmark that gates each release — a real car-physics simulator with known engines, controlled synthetic recovery, real repeated road sessions, raw signal quality, outlier honesty, and a committed precision history. Nothing here is a mock-up.
Against a real car-physics simulator
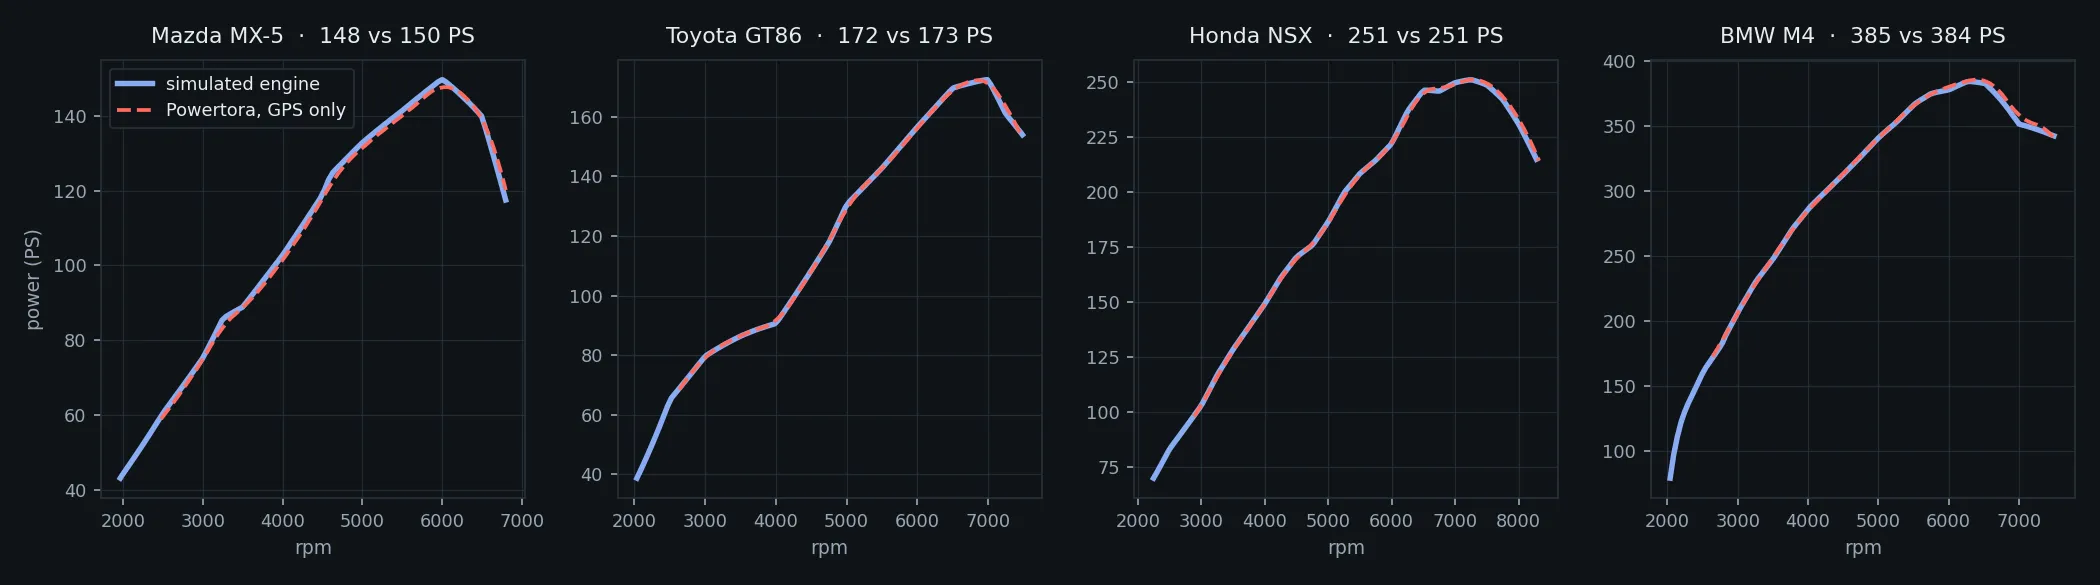
A real car-physics simulator is the one place a road pull has a known answer: it runs a published engine map, and we read it straight from the physics while a script drives the exact Powertora protocol — pull, coast, 25 Hz GPS-equivalent trace. Across every car the simulator has — 290 cars, 580 recorded pulls, 152 of them road cars from a city hatch to a mid-engine V12: with the car’s physical data known the power sits within 0.5% of the simulated engine (median), and from the GPS trace and the car’s weight alone within 1.0%, three road cars in four within 2%. The peak sits within 90 rpm of where the engine put it, six engine shapes from cam step to turbo plateau come back within 0.4% of their shape, and five rev-limiter behaviours read the same peak within 0.5%. Tyre slip, engine inertia and the fuel cut at the end are modelled from physics, not assumed.
The math is controlled
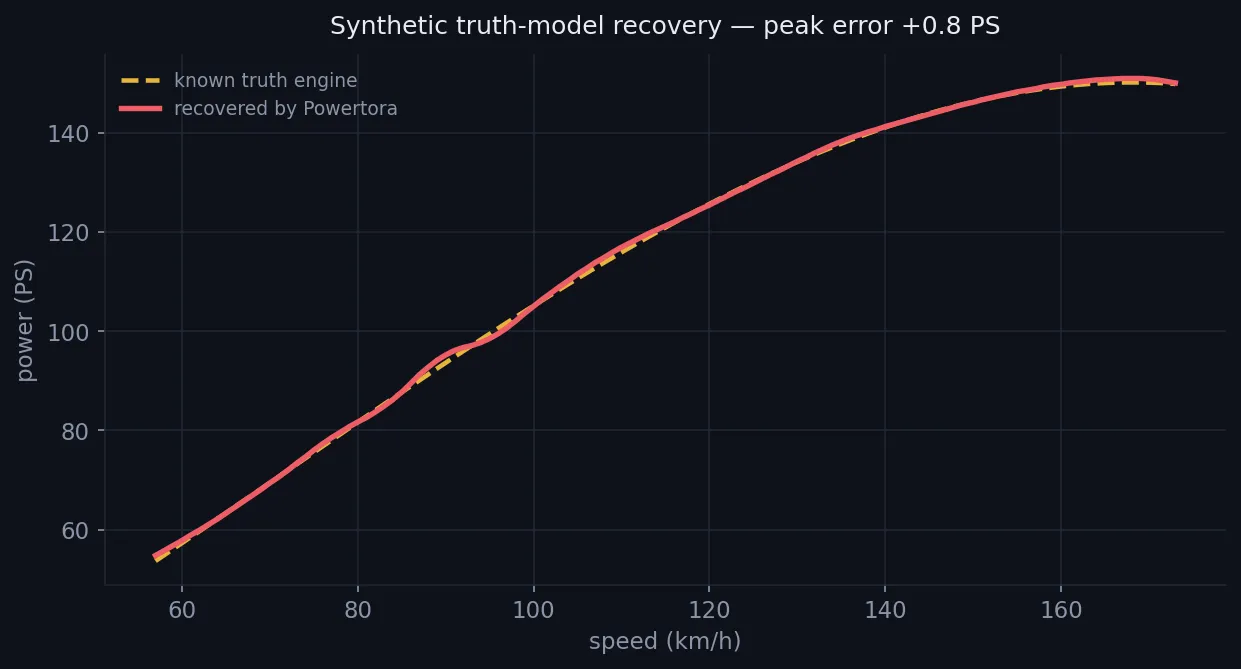
We build a known engine curve, simulate a protocol pull and coast-down with a GPS-noise model calibrated from real RaceBox and Dragy hardware, then run the full production pipeline and score the recovered curve against the truth. Across 30 noise seeds and four engine shapes (smooth, cam-step, intake-ripple, fine texture) peak power lands within about ±1.3 PS — so the recovery is measured against ground truth, not asserted.
Real runs repeat
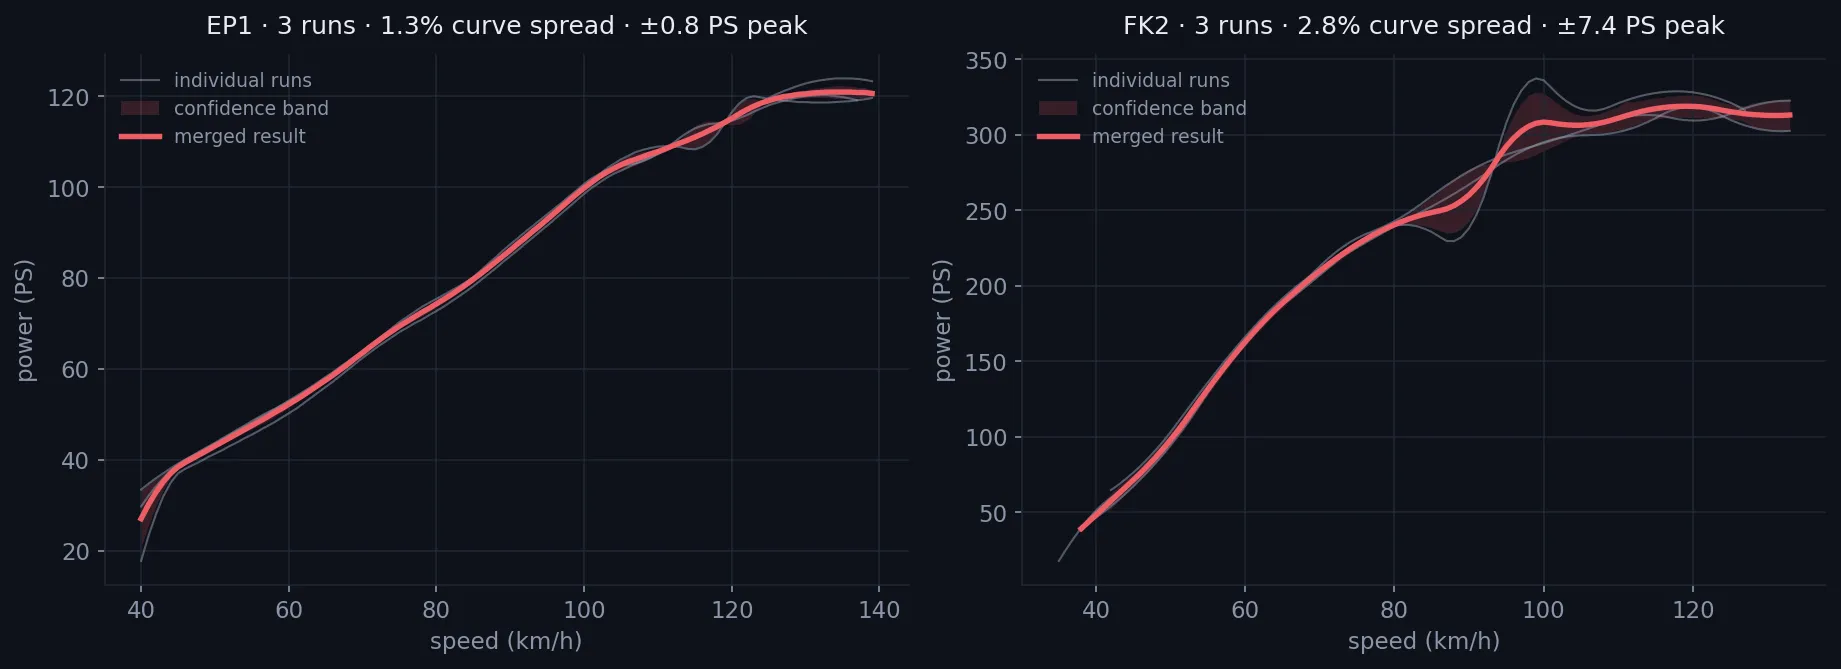
No ground truth exists for a real car, so precision is repeatability. Here are the last three road runs for a naturally-aspirated EP1 and a turbo FK2 — the faint lines are individual pulls, the bold line is the merged result, and the shaded band is its measured run-to-run scatter. The EP1 session holds to ~1.3% (±0.8 PS at the peak); the noisier turbo FK2 to ~2.8% — and the band widens exactly where the runs actually disagree.
25 Hz signal, honestly filtered
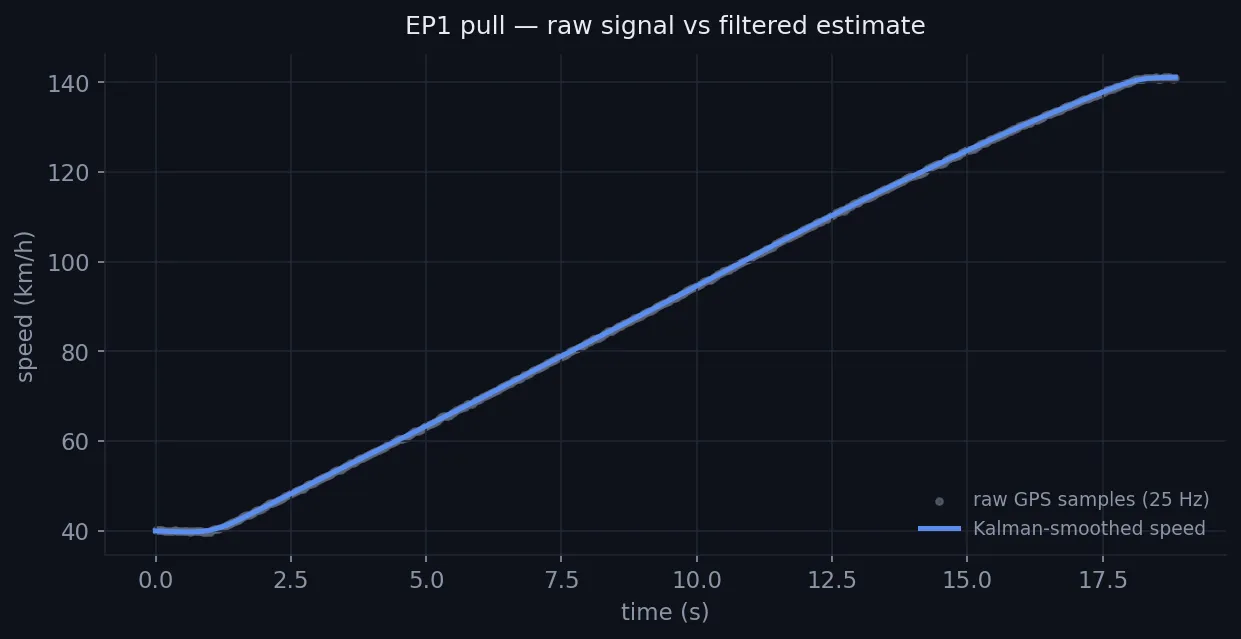
A power curve is only as good as the speed trace behind it. This is a real pull: every raw 25 Hz GPS sample (dots) and the zero-phase Kalman estimate the pipeline differentiates for acceleration (line). High sample rate plus a physics-aware smoother is what turns raw Doppler speed into a clean curve — without rounding away real engine features.
Bad data is dropped, not hidden
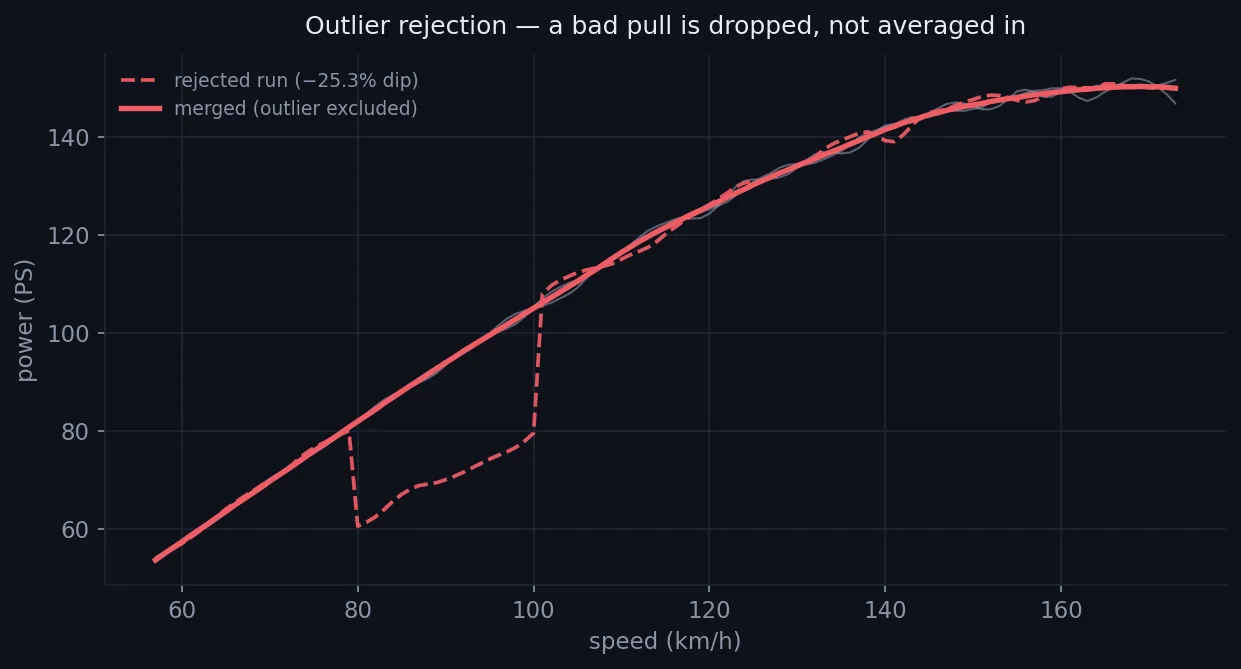
A merge only helps if a bad pull can’t poison it. When a run falls sustainedly below the consensus — wheelspin, a missed shift, a lift — it is flagged and excluded from the average rather than quietly dragging the number down. (Illustrative: a synthetic wheelspin dip injected into one of three runs.)
Tracked on every change
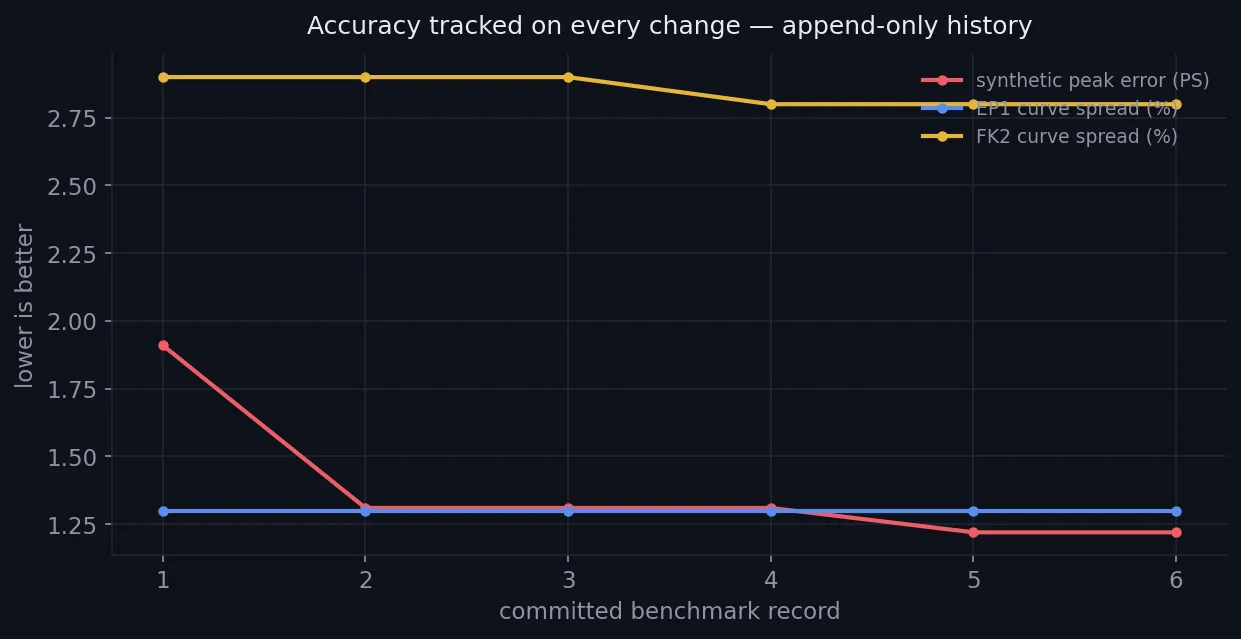
Accuracy isn’t a launch-day claim — it’s a committed benchmark. Every change to the pipeline is scored against the synthetic suite and the real fixtures before it ships, and the result is appended to a committed history. Precision is engineered and watched over time, not asserted once.
The method, in one line
A real car-physics simulator proves the answer is right; synthetic engines prove the math is controlled; real fixtures prove it repeats; the committed history proves it stays that way. Power is crank-equivalent by measured loss, metric PS, DIN-corrected — the honest number, with its uncertainty shown.
← Back to Powertora